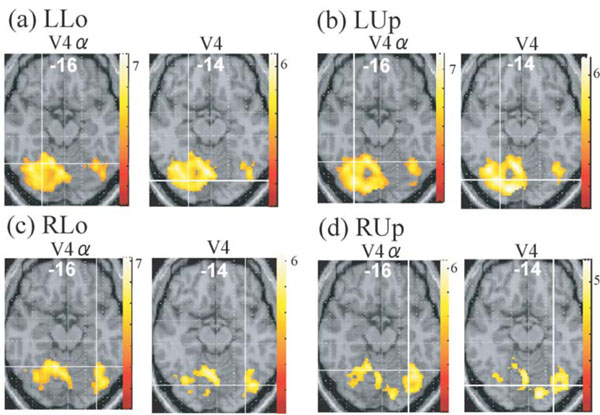
Fig. (3) Regions whose activities were greater for colour task than for rest in each quadrant presentation (P <0.01, corrected for multiplecomparisons using false discovery rate, k > 20 voxels), displayed on the axial images where putative V4 or V4 exists. Intersection of linescorresponds to the averaged coordinates obtained in the individual subject analysis (cf. Fig. 4). LUp, left upper; LLo, left lower; RUp, rightupper; RLo, right lower.