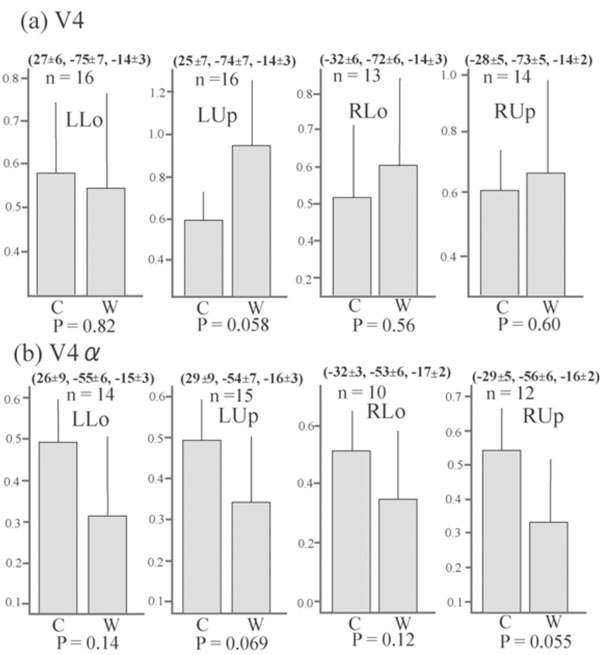
Fig. (4) Average adjusted signal change of the putative V4 and V4α . The MNI coordinates (mean ± SD) and number of sampled subjects isalso shown. The number of subjects was not constant since only subjects who showed significant activation for each contrast were selected.There is a tendency that the signal changes of putative V4α , but not of putative V4/8, were greater for colour task than for word task in allquadrant presentation. Bars represent the limit of the 95% confidence interval around the mean.