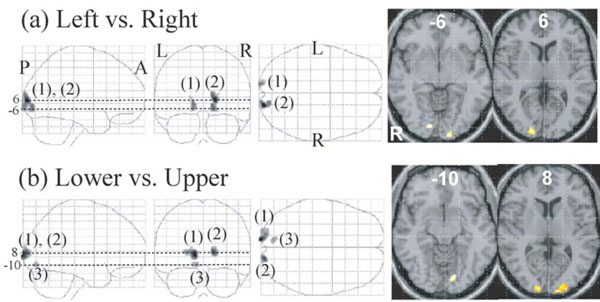
Fig. (5) Regions whose activations were different between the left and right presentation (a) and between the lower and upper presentation (b) (P <0.01, corrected for multiple comparisons using false discovery rate, k > 20 voxels). They are displayed on a glass brain (left) and onthe axial images of the MNI template (right). Figures refer to the axial coordinates of MNI space. (a) The left V1/2 (1) showed a greater responseto the right than to the left field stimuli and the right V1 (2) showed a greater response to the left than to the right stimuli. (b) Twoclusters of V1/2 (1, 2) showed a greater response to the lower than to the upper stimuli and one cluster of V1 (3) showed a greater responseto the upper than to the lower stimuli.