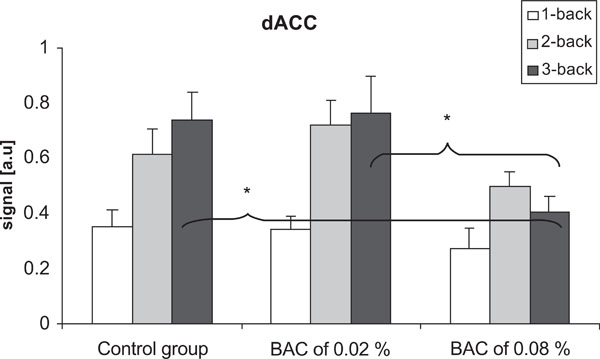
Fig. (4) Differences in the signal in the dACC in the control group and at BACs of 0.02% and 0.08%. There were no significant differences between the groups when performing the 1-back and the 2-back task. When performing the 3-back task, there were significant decrease in the signal at the BAC of 0.08% compared to the two other groups. Vertical bars represent standard error of the means.*p < 0.05.