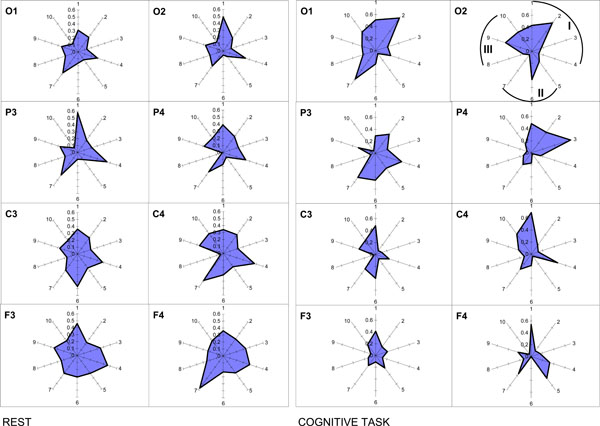
Fig. (10) Nonrandom ISS values for ten pairs of five main frequency bands. The radian-axis displays the labels of the frequency band pair connection. The median-axis displays the average values of ISS for the frequency band pair connection within each category. Sections I, II, and III of polar diagram correspond to the frequency band pair connections grouped on the basis of closeness of frequency bands to each other in the power spectrum. I section contains all neighboring pairs of frequency bands: 1 – delta-theta; 2 – theta-alpha1; 3 – alpha1-alpha2; 4 – alpha2-beta. II section contains pairs of frequency bands which are separated by one band: 5 – delta-alpha1; 6 – theta-alpha2; 7 – alpha1-beta. III section contains pairs of frequency bands separated by two and more bands: 8 – delta-alpha2; 9 – theta-beta; 10 – delta-beta.