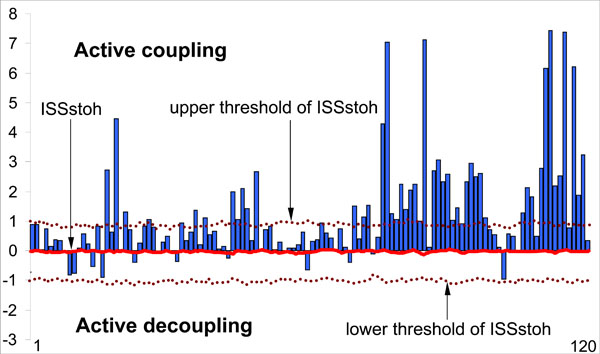
Fig. (5) Schematic illustration of the index of structural synchrony (ISS) and its stochastic levels. As an example, the calculations of ISS are shown for 16 EEG channels. The Y-axis displays the ISS values found in the experiment (illustrated as bars). The X-axis displays the 120 possible pair combinations of 16 EEG channels (1 = O1-O2, 2 = O1-P3, 3 = O1-P4, ... 118 = Fz-F7, 119 = Fz-F8, 120 = F7-F8). The data presented for a healthy subject in rest condition, eyes closed. Figure is modified from the Fingelkurts et al. 2004, Human Brain Mapping©.