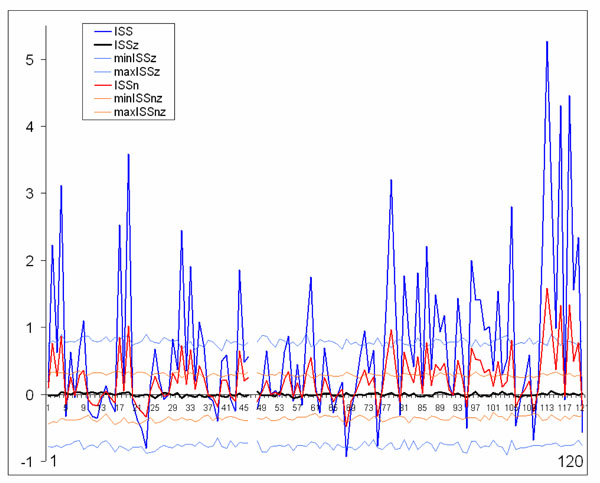
Fig. (7) Schematic illustration of index of structural synchrony (ISS) and its normalized version (ISSn) with each own stochastic levels. As an example, the calculations of ISS and ISSn are shown for 16 EEG channels. The Y-axis displays the ISS and ISSn values found in the experiment. The X-axis displays the 120 possible pair combinations for 16 EEG channels (1 = O1-O2, 2 = O1-P3, 3 = O1-P4, ... 118 = Fz-F7, 119 = Fz-F8, 120 = F7-F8). ISSz indicates the stochastic mean values of structural synchrony obtained during the computer simulations; min/max ISSz indicate the stochastic levels for ISSz; normalized min/max ISSnz indicate the stochastic levels for the normalized ISSnz. A line representation was chosen instead of bars for ease of comparison. Figure is modified from Fingelkurts et al., 2007, Human Brain Mapping ©.