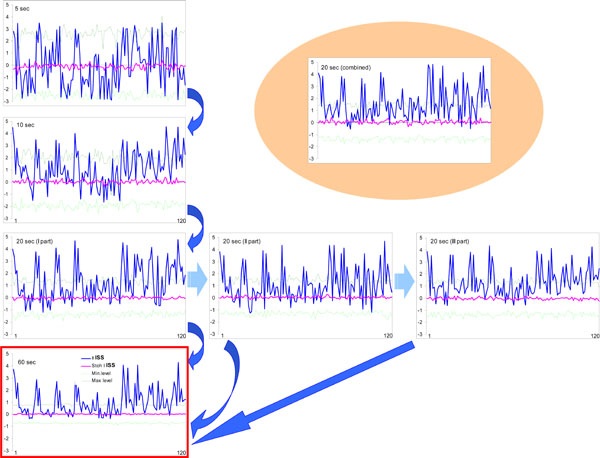
Fig. (8) Index of structural synchrony (ISS) of cortical alpha activity for different time intervals. The Y-axis displays the ISS values. The X-axis displays the 120 possible pair combinations of 16 EEG channels (1 = O1-O2, 2 = O1-P3, 3 = O1-P4, ... 118 = Fz-F7, 119 = Fz-F8, 120 = F7-F8). A line representation was chosen instead of bars for ease of comparison. Explanations are located in the text. Figure is modified from Fingelkurts et al., 2003, NeuroImage©.