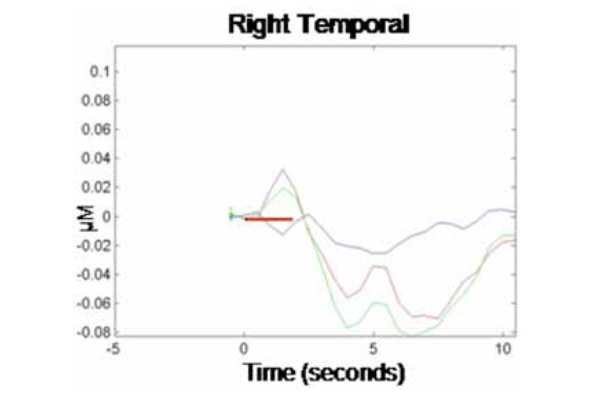
Fig. (2) Hemodynamic Response Function: Right temporal area (T
4
)
Corresponding grand average hemodynamic (HbO
2
, HbR, and HbT) response curve across 10-sec epochs for the right temporal region.