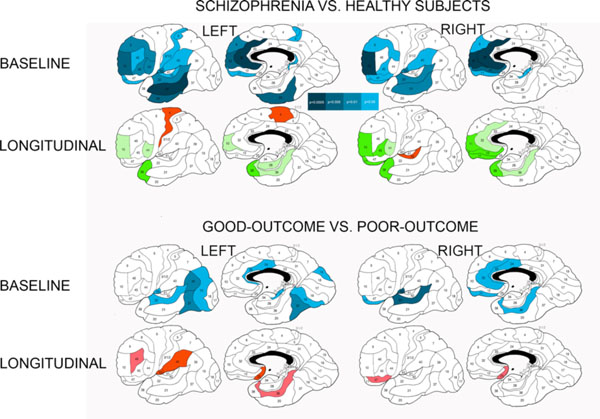
Fig. (2) Differences in baseline relative gray matter volumes and their longitudinal changes between patients with schizophrenia and healthy subjects and between schizophrenia patients with good and poor outcomesa.a Significant between-group differences as assessed with Student’s t test for each Brodmann’s area (two-tailed p-values are color-coded in the bar). Baseline volumes: Blue colors denote areas with smaller relative gray matter volumes in patients with schizophrenia than in healthy subjects and in poor-outcome patients in comparison to patients with good outcome. Longitudinal changes (relative volumes at baseline scan minus relative volumes at follow-up scan): Green colors indicate areas with greater volume decline in healthy subjects than in schizophrenia patients at two-tailed p<0.05 (dark-green) and p<0.1 (trend, light-green). Red colors indicate areas with greater volume decline in schizophrenia patients than healthy subjects or in poor-outcome patients than in patients with good outcome at p<0.05 (burgundy hue) and p<0.1 (trend, scarlet hue).