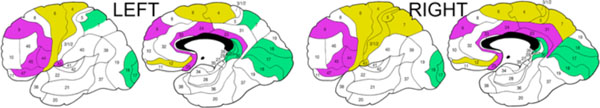
Fig. (3) Composite ANCOVA-baseda diagram of the differences in longitudinal changes in white matter anisotropy between schizophrenia patients with good and poor outcomes.a Significant diagnostic group×time×Brodmann’s area interactions in all ANCOVAs are illustrated based on the decomposition of the mean effects for individual Brodmann’s areas. Lilac color indicates areas with greater anisotropy decline in patients with good outcome than in patients with poor outcome. Khaki color indicates areas with greater anisotropy decline in patients with poor outcome than in patients with good outcome. Green color indicates areas with greater anisotropy increase in patients with poor outcome than in patients with good outcome. Areas with between-group ANCOVA differences in relative anisotropy of less than 0.2 points were left blank.