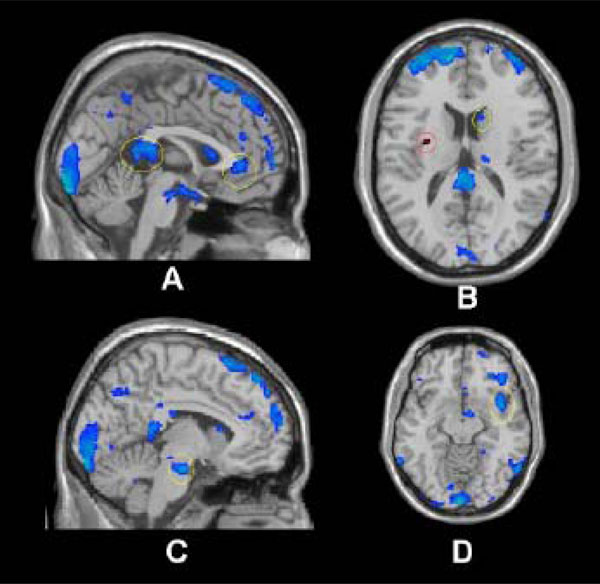
Fig. (1) low SES > high SES, positive vs. neutral. Threshold at p=.05 for visualization. Regions marked in blue (superimposed on an anatomical image) had statistically significant BOLD decreases whereas regions in red indicate significant BOLD increases.A) Cingulate (anterior and posterior); B) Caudate (yellow), Insula (red); C) Pons; D) Insula.