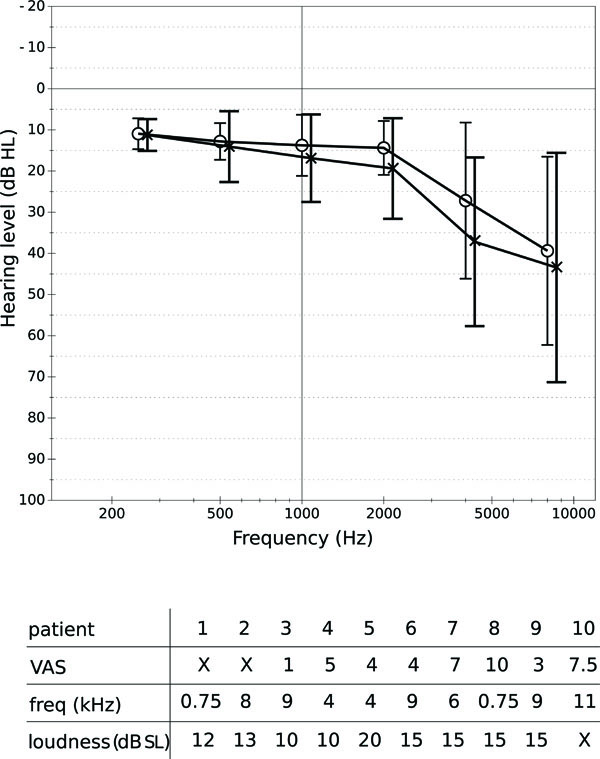
Fig. (1) A: Hearing levels (in dB HL) of the tinnitus patients at several frequencies. Circles represent the average levels for the right ear, crosses represent average levels for the left ear. The whiskers show standard deviations. B: Severity (VAS), frequency and loudness level (indB SL) of tinnitus perceived by the patients. An “X” is used when data were not available.