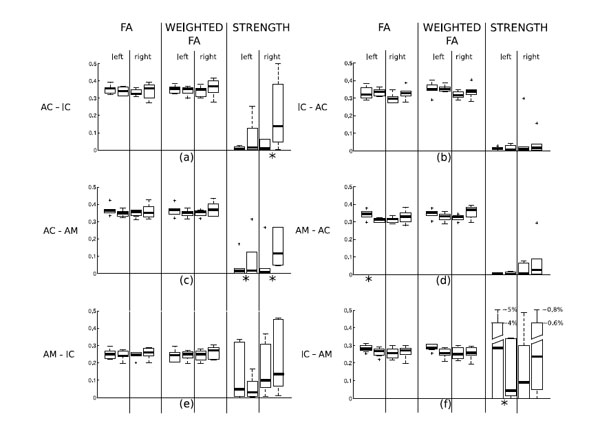
Fig. (2) Box & whisker plots of the distributions of FA, weighted FA and strength in the paths of tinnitus patients and controls. For each pairof box and whiskers, the left data set corresponds to control subjects and the right one to tinnitus patients. Panel (a) shows the statisticalresults computed on the tract AC-IC; panel (b) of the tract IC-AC, panel (c) of the tract AC-AM, panel (d) of the track AM-AC, panel (e) ofthe tract AM-IC, panel (f) of the tract IC-AM. Paths where a statistically significant difference between tinnitus patients and controls was
found (see Table 1(a)) are marked with an asterisk below the plot.