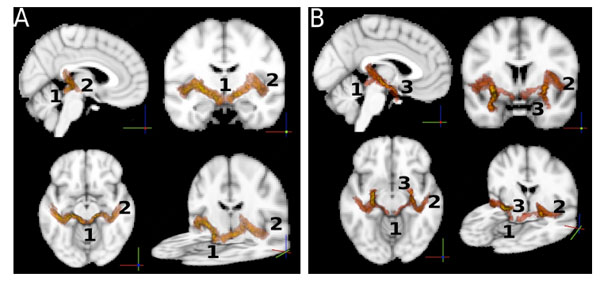
Fig. (4) A: Connections of the auditory pathways. Each path shown is the group average of the normalized (to the MNI standard template) paths of all the subjects. The intersection of two paths (A → B, B → A) between any pair (A,B) of ROIs was used to define the location of a connection. The image shows iso-probability surfaces, coded with color (the color scale ranges from yellow to red, where yellow indicates the highest probability to find the path in that brain region, and red indicates lower probabilities). Track endpoints are identified by numbers. 1: inferior colliculus, 2: auditory cortex, 3: amygdala. The iso-probability surfaces are semitransparent so that an exploration of all voxels is possible. B: the connections between the amygdala and the inferior colliculus, overlapped with the connections between the amygdala and the auditory cortex.
.