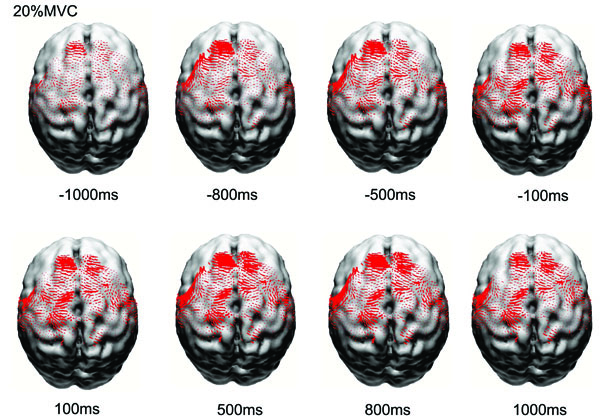
Fig. (1) Reconstructed normalized and averaged cortical currents at 20% maximal voluntary contraction force of 8 subjects at eight time
points from early preparation to holding phases of the handgrip task. The size of the red dots is proportional to the local current density. Only
currents in motor related cortical area (left M1, left S1, PM&SMA, right M1, right S1) are shown here. The current density exhibited nonlinear
alterations throughout the motor control process.