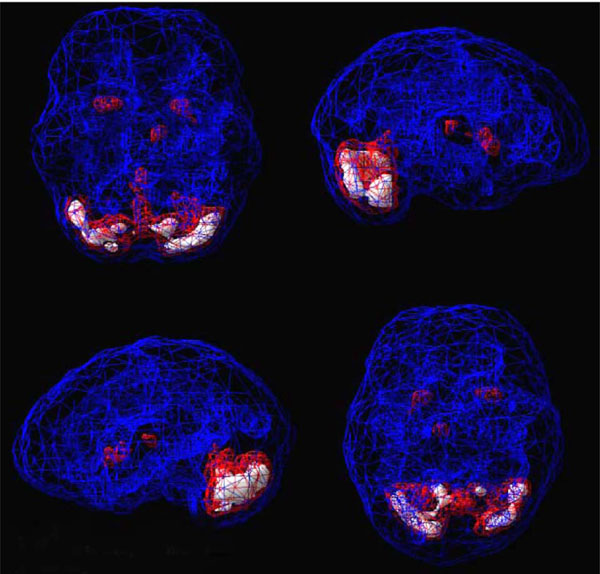
Fig. (2) Shows a healthy 3D active rendering of SPECT information, looking at areas of increased perfusion. Blue equals average perfusion, red equals the top 15% of perfusion and white is the top 8%. Activity above these levels is 2 and 3 standard deviations above normal outside the cerebellum(10). A healthy active scan with HMPAO shows increased perfusion in the cerebellum.