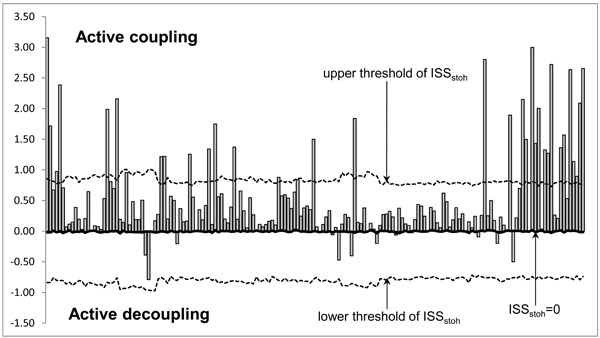
Fig. (2) Schematic Illustration of the Index of Structural Synchrony (ISS) and its Stochastic Levels. As an example, the calculations of
ISS are shown for a healthy subject in rest condition, eyes closed. The Y-axis displays the ISS values found in the experiment (illustrated as
bars). The X-axis displays the 170 possible pair combinations of 20 EEG channels (1 = O1-O2, 2 = O1-P3, 3 = O1-P4, … 168 = Fz-F7, 169 =
Fz-F8, 170 = F7-F8).