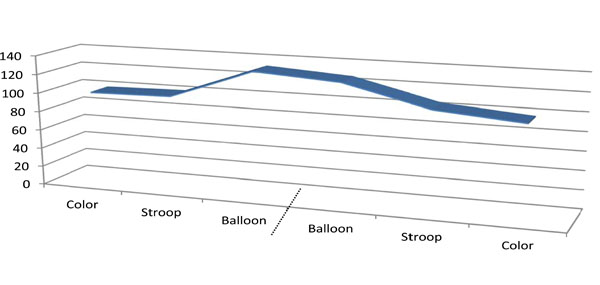
Fig. (1)
Area under the curve (mean) during the three conditions after merging (dashed bar) the two subgroups of participants. (counter balanced order of presentations; n=23 in each order).