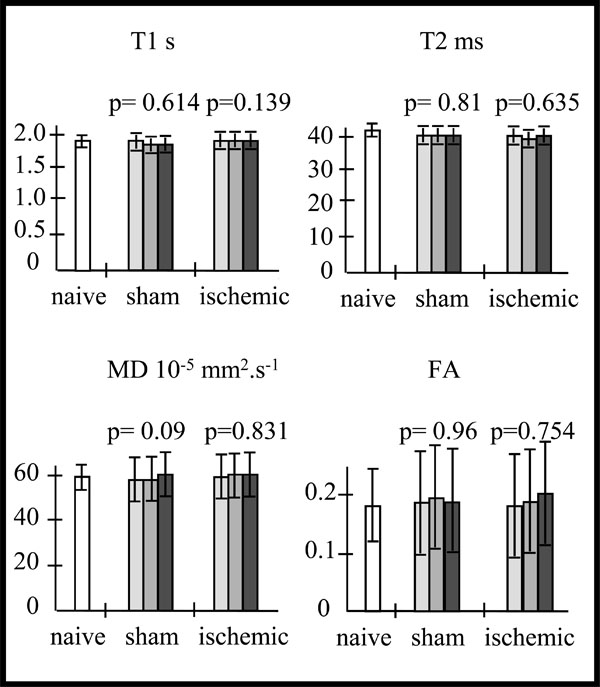
Fig. (2) Mean values of T1, T2, mean diffusivity (MD) and fractional anisotropy (FA) in the cortex of the naive (na) mice (n=5) (in
white).Variations of these MR parameters mean values, in the contralateral cortex of the sham(sh) (n=3) and ischemic (isc) (n=10) mice over
time (D7-D8 : light grey, D10-D11 : intermediate grey, D13-D14 : dark grey), and p values from the one way repeated measures ANOVA:
Whatever the MR parameter, there is no statistically significant difference over time for the sham mice (T1: DFr=4; F=0.553; p=0.614; T2:
DFr=4; F=0.222; p=0.810; MD: DFr=4; F=4.679; p=0.090; FA: DFr=4; F=0.0412; p=0.960) nor for the ischemic mice mice (T1: DFr=18;
F=2.206; p=0.139; T2: DFr=18; F=0.465; p=0.635; MD: DFr=18; F=0.188; p=0.831; FA: DFr=18; F=0.287; p=0.754).