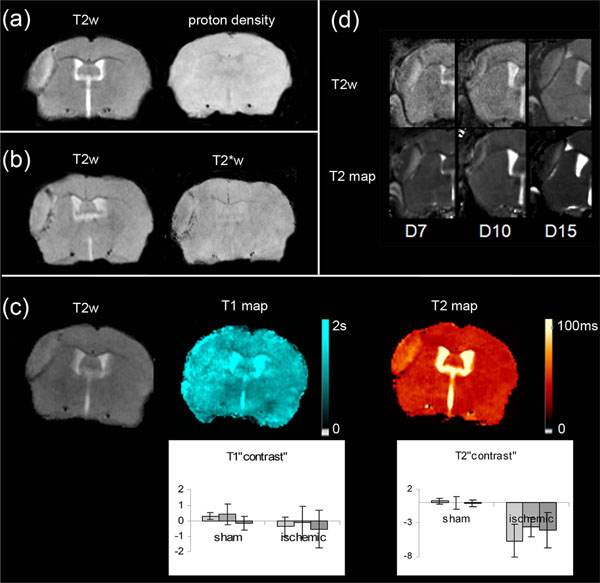
Fig. (4) Maps and weighted-images from 6 ischemic mice (a): T2-weighted and proton density-weighted spin-echo images of the infarct
core (b): T2-weighted and corresponding T2*-weighted images (c): T2-weighted image and the corresponding T1 and T2 maps. Inserted
graphs show evolution of T1 and T2 “contrast” in the sham (n=3) cortex and LA (n=10) as a function of time (D7-D8 : light grey, D10-D11:
intermediate grey, D13-D14 : dark grey).One way repeated measures ANOVA showed that there was no statistically significant difference
among the time for T1 (DFrsham=4; Fsham= 1.006; psham=0.443; DFrLA=18; FLA= 0.593; pLA =0.559) and T2 (DFrsham=4; Fsham=
0.058; psham=0.944; DFrLA=18; FLA= 2.086; pLA=0..144) “contrast” values (d): Comparison between T2-weighted images and the
corresponding T2-maps of the injured area at various time points after MCAo, on different mice.