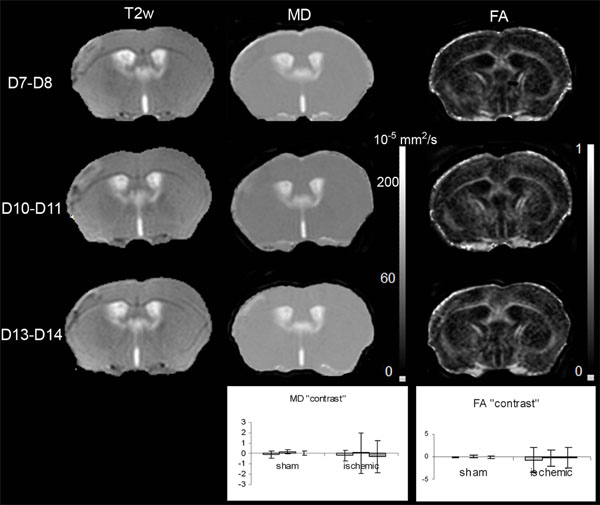
Fig. (5) T2-weighted (T2w), and the corresponding mean diffusivity (MD) and fractional anisotropy (FA) maps, on Days 7-8, 10-11 and 13-14 after MCAo. Inserted graphs show evolution of MD and FA “contrast” for the sham (n=3) cortex and LA (n=10) as a function of time
(D7-D8 light grey, D10-D11intermediate grey, D13-D14dark grey). The one way repeated measures ANOVA showed that there was no
statistically significant difference against time for MD (DFrsham=4; Fsham= 1.707; psham=0.291; DFrLA=18; FLA= 0.106; pLA =0.900)
and FA (DFrsham=4; Fsham= 1.448; psham=0.336; DFrLA=18; FLA= 0.449; pLA =0.645) “contrast” values.