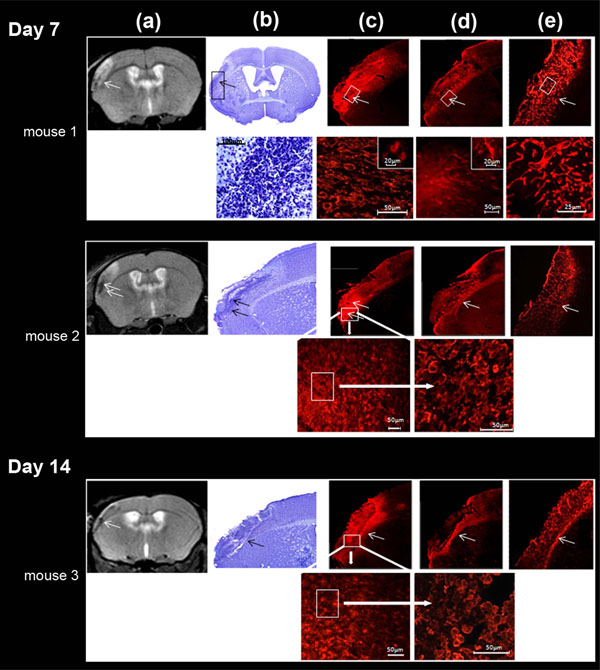
Fig. (6) Correlation between MRI T2-weighted image (a), cresyl violet staining (b), microglial immunocytochemistry (c), astrocyte
immunocytochemistry (d) and laminine immunocytochemistry (e) in LA (arrow) of the ischemic lesion, defined on MRI, at days 7 and 14.
These different regions were magnified for mouse 1 (day 7) (bottom row); microglial cells were further taken at two different magnifications
(intermediary and high magnifications) for mouse 2 (day 7) and mouse 3 (day 14) (bottom row) . High microglial cell (Iba1-positive
labeling) density was found in LA; Iba1 cells were activated and characterized by a typical amaeboid shape. Astrocytes (GFAP-positive
labeling) were activated exclusively at the outside border of the infarct and phenotype characterized by thick and ramified branches. GFAP
cells were far less numerous than Iba1 cells. Laminin positive cells were uniformly found in the whole infarct area and not specifically at the
border of the infarct. LA matched preferentially with high microglial cell density.