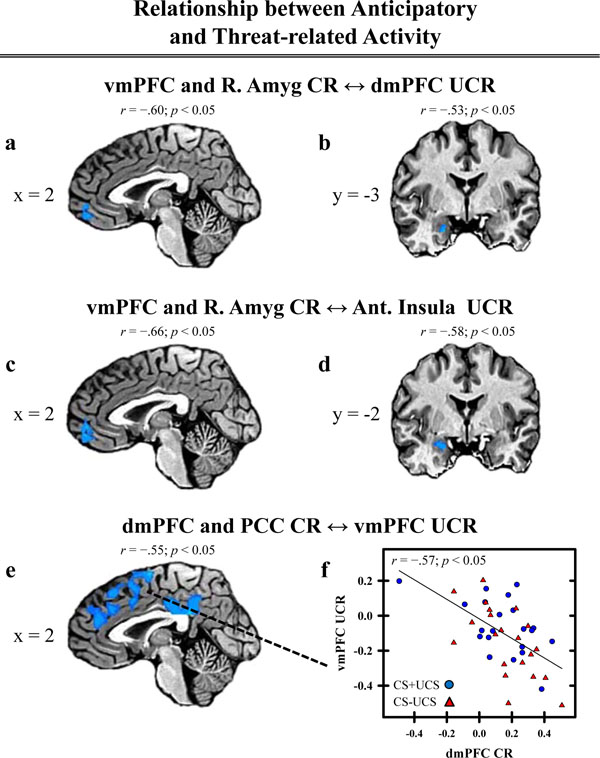
Fig. (4) Relationship between anticipatory and threat-related activity. Threat-related activity, extracted from the ROI depicted in Table 1 and
Figure 3, was included in a regression analysis to investigate differences in the relationship between anticipatory activity (i.e. CR) and threat-related
activity (i.e. UCR) on CS+UCS and CS−UCS trials. A negative relationship between anticipatory and threat-related activity (% signal
change) was observed in several areas of the PFC, cingulate, and amygdala (a-e). Correlation values comparing the anticipatory and threat-related
response within these brain areas are presented above the brain images. The correlation value above image (e) represents activation
observed between PCC CR and vmPFC UCR. The correlation value for dmPFC CR and vmPFC UCR is presented in graph (f). Talairach
coordinates for the depicted areas of activation are presented in Table 4 and labeled with letters (a-e) corresponding to each image above.