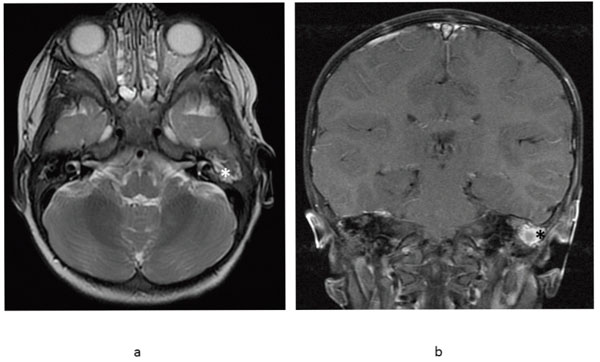
Fig. (5) Follow-up axial T2 weighted FSE MR image (a) demonstrates interval decrease in the size of the left tympanomastoid mass
(asterisk) consistent with improving Langerhans' cell histiocytosis. Coronal T1 weighted FSE contrast enhanced T1 (b) demonstrates the fluid
and enhancing soft tissue involving the left mastoid has improved (asterisk) and has resolved on the right.