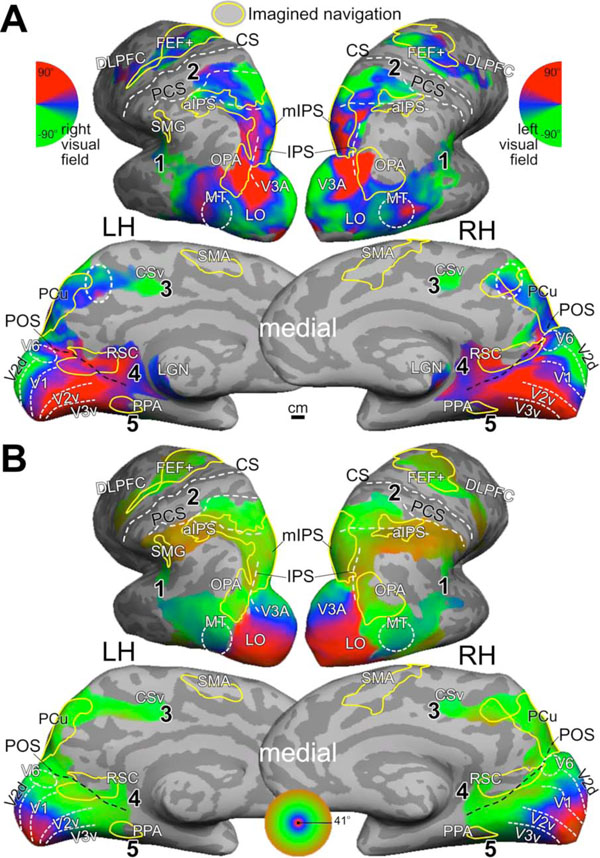
Fig. (4) Mental navigation network overlaps with retinotopic maps. (A) Average polar-angle map. The dashed circle in anterior precuneus
indicates a complete retinotopic map. (B) Average eccentricity map. Both maps were rendered at F(2,230) = 3.04, p<0.05 and masked by t(23) =
2.07, p<0.05, cluster corrected. Yellow contours indicate regions activated during imagined navigation in Fig. (3) (F(2,102) = 4.82, p<0.01;
masked by t(9) = 2.26, p<0.05, cluster corrected). The numbers in bold type indicate visual streams mentioned in text.