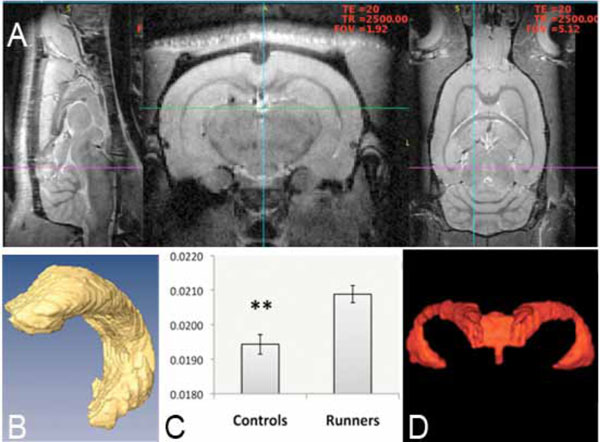
Fig. (2) MRI-based 3-D analysis of hippocampus at 9.4 T. Images (A) show a brain from a sagital, axial and coronal view. Volumetric
analysis of segmented hippocampus (B) and whole brain gave an increase in hippocampal/total brain size when comparing runners to nonrunners
(control) (C). No change was noted in ventricular volume and a representative image (D), which is showing most frontal parts of the
ventricular system is displayed. Values are mean hippocampus/total brain ±SEM (**, P < 0.01, unpaired two-tailed Student’s t-test, n=15).