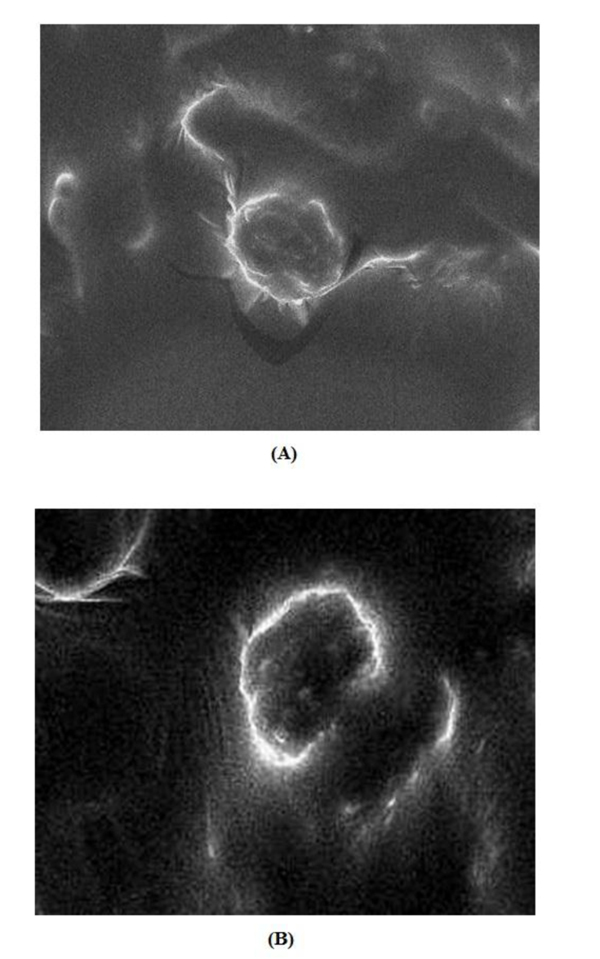
Fig. (5)
SEM images of ethosomal formulations (
A
) F2, (
B
) F1.