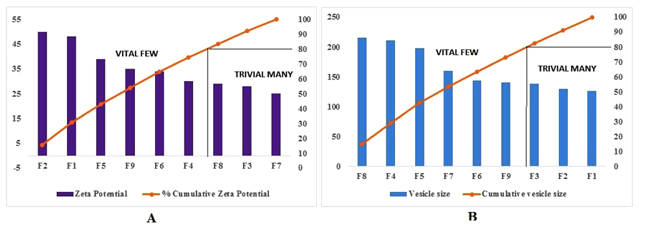
Fig. (6)
Pareto chart for cause and effect analysis.