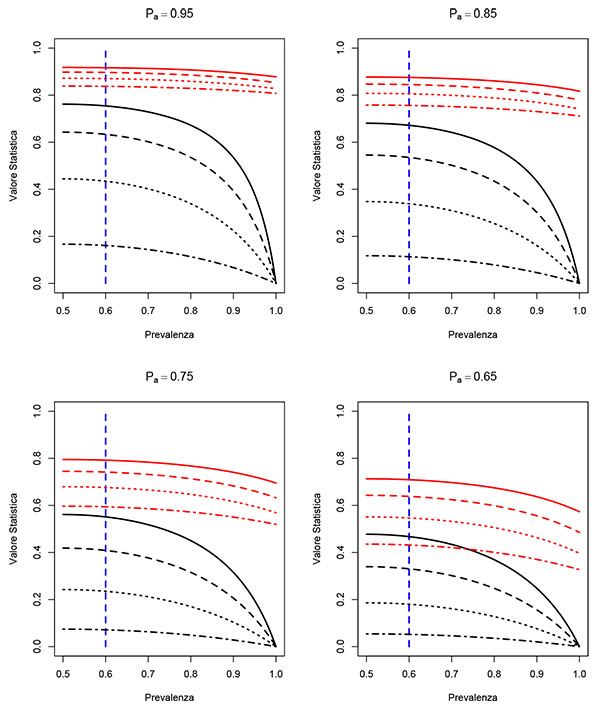
Fig. (1)
Cohen's Kappa (black lines) and AC1 (red lines) values computed by increasing the prevalence. The curves refer to several values of observed agreement (Pa), and raters’ sensitivity and specificity. It is assumed that sensitivity and specificity values are equal and the same for both the raters.