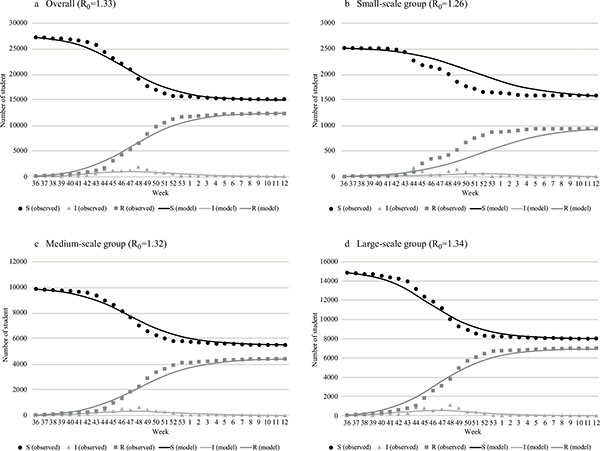
Fig. (2)
Comparison of the time transition curve of 3 components between observations (absentee survey) and the SIR model.