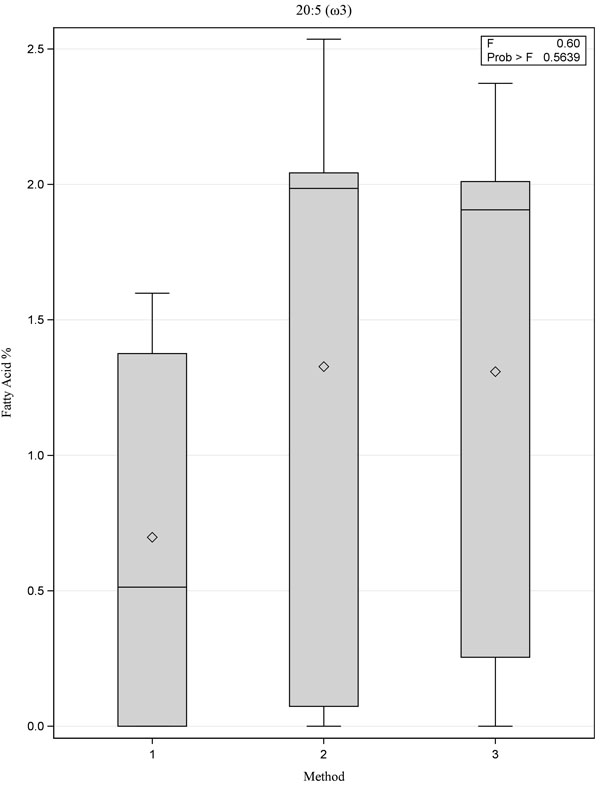
Fig. (2)
Box plot showing comparison of fatty acid 20:5 (ω3) for the three methods, p=0.56.