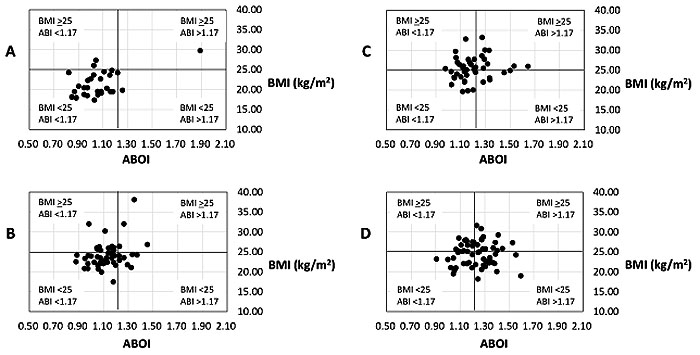
Fig. (3) ABOI versus BMI of female subjects of different age groups. The ABOI values of subjects are plotted against their BMI values. The mean ABOI of the entire female cohort was 1.17 (the position is marked by the vertical line) according to the data in Fig. (2). BMI higher than 25 was considered high and unhealthy. A) Ages 23-38 years (p = 0.0036). B) Ages 40-59 years (p value = 0.064). C) Ages 60-69 (p = 0.260). D) Ages 70-88 years (p = 0.732).