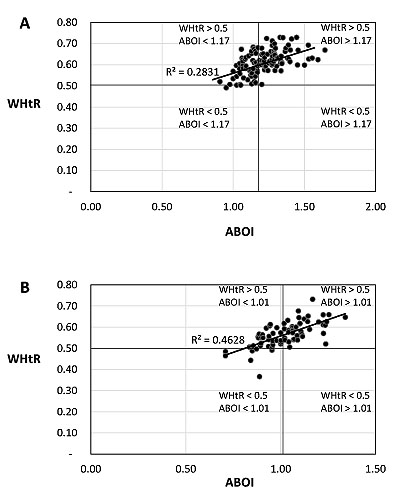
Fig. (5) ABOI versus WHtR of female and male subjects. The ABOI versus WHtR in (A) females and (B) males. The R2 values are shown in the graphs and the p value for both (A) and (B) is < 0.01. The mean ABOI of the entire female cohort was 1.17 (the position is marked by the vertical black line) according to the data in Fig. (2). The mean ABOI of the entire male cohort was 1.01 (the position is marked by the vertical black line) according to (Fig. 2).