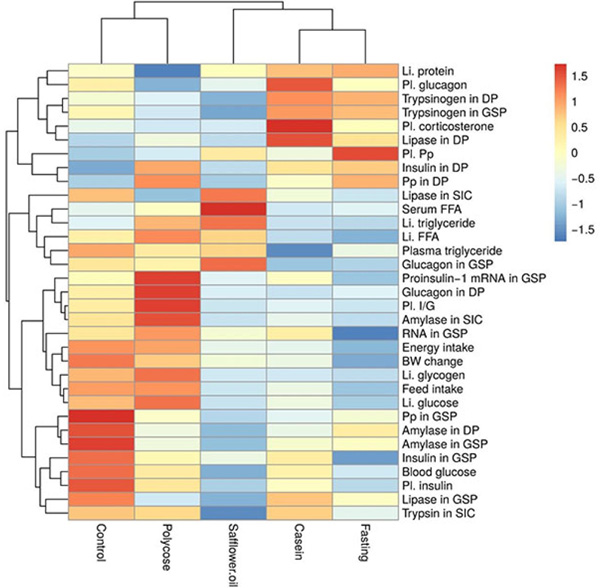
Fig. (3)
Heatmap indicating diet effects on the parameters measured as very positive +1.5 to very negative -1.5. The two way claster analysis indicate the closeness of parameters (vertical) and the treatment groups (horizontal) to each others.