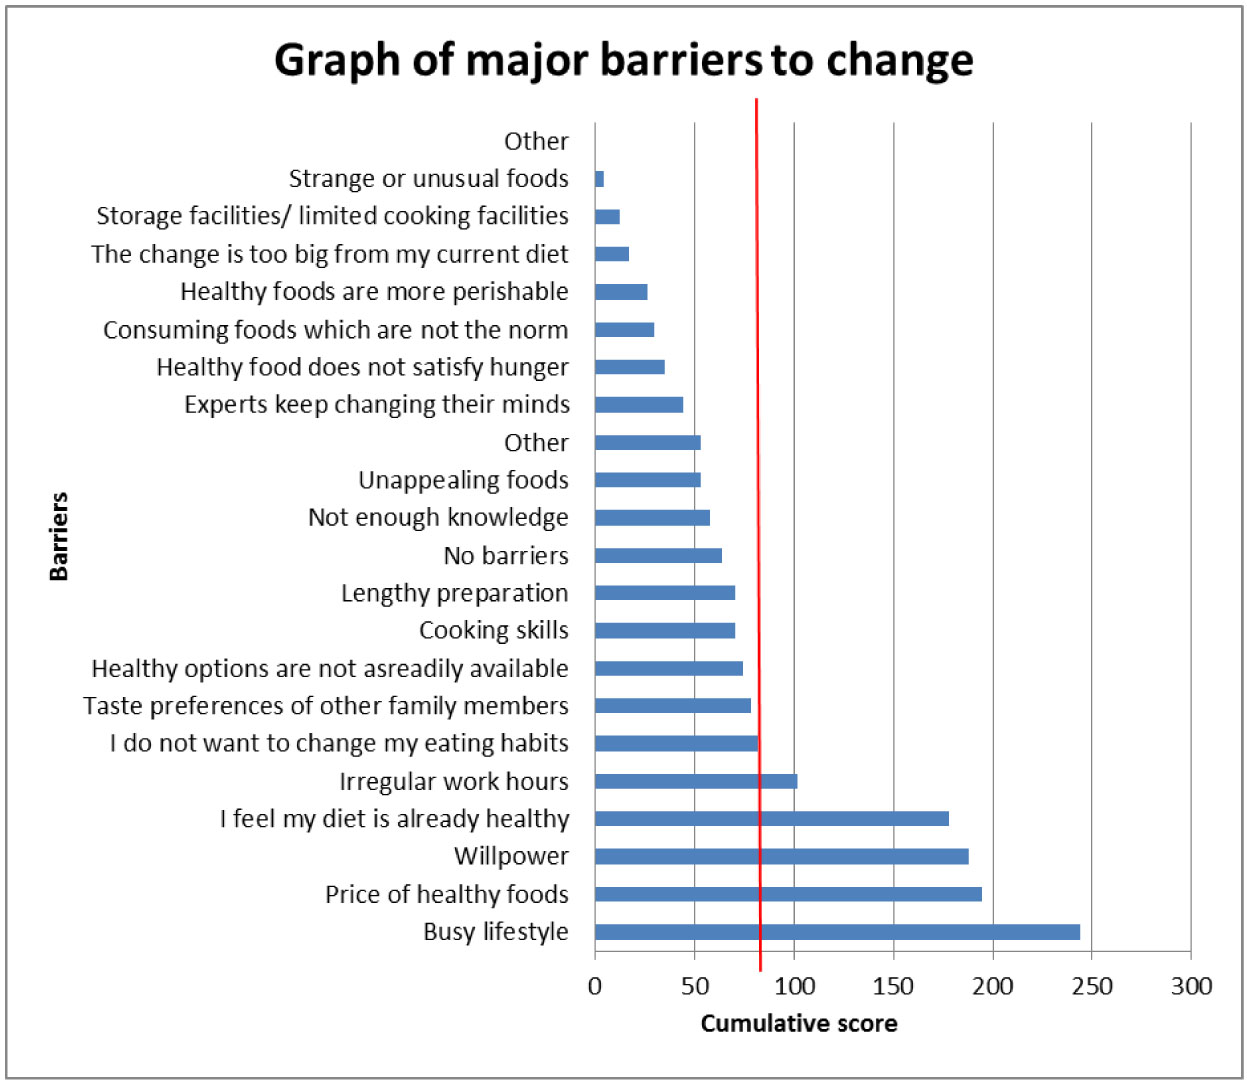
Fig. (1) A bar chart showing major barriers to change plotted against the cumulative barriers to change score. The cumulative score was based on the order in which participants prioritised the list of barriers to change, such that factor 1 contributed 3 points, factor 2, 2 points and factor 3, contributed 1 point. The red line represents the inflection point.