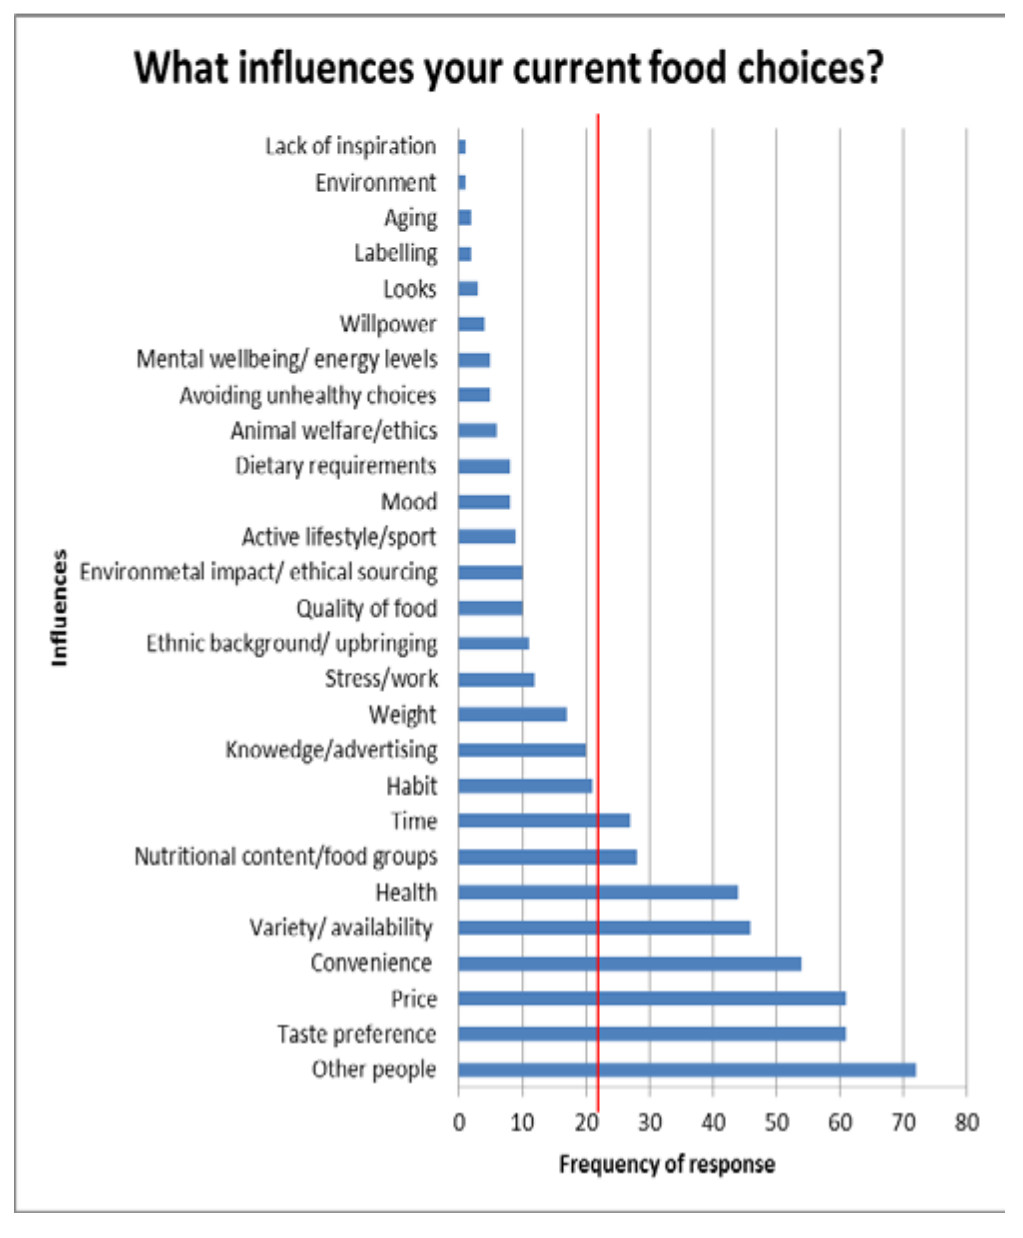
Fig. (2)
A bar chart displaying influences on food choices against the number of participants who described the influence.