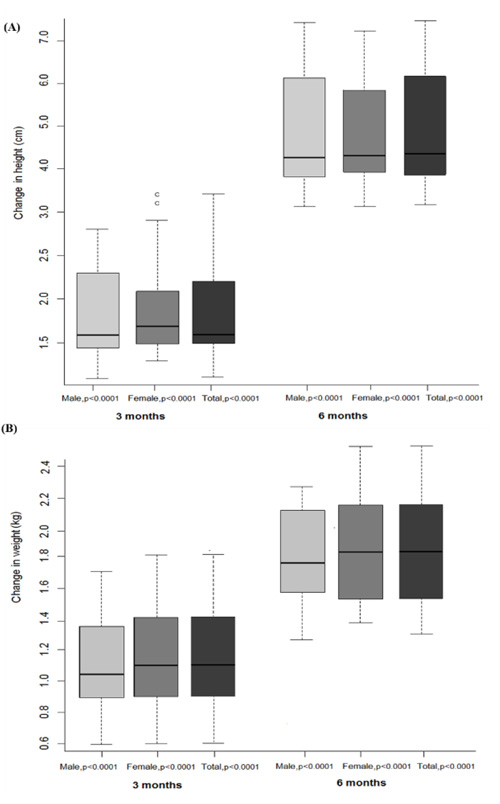
Fig. (1) Boxplot of median change in (a) height (cm) and (b) weight (kg) from baseline to 3 months and 6 months of intervention. The boxes represent the interquartile range; horizontal lines represent the median value and circles represent outliers. p-value is from Wilcoxon signed-rank test.