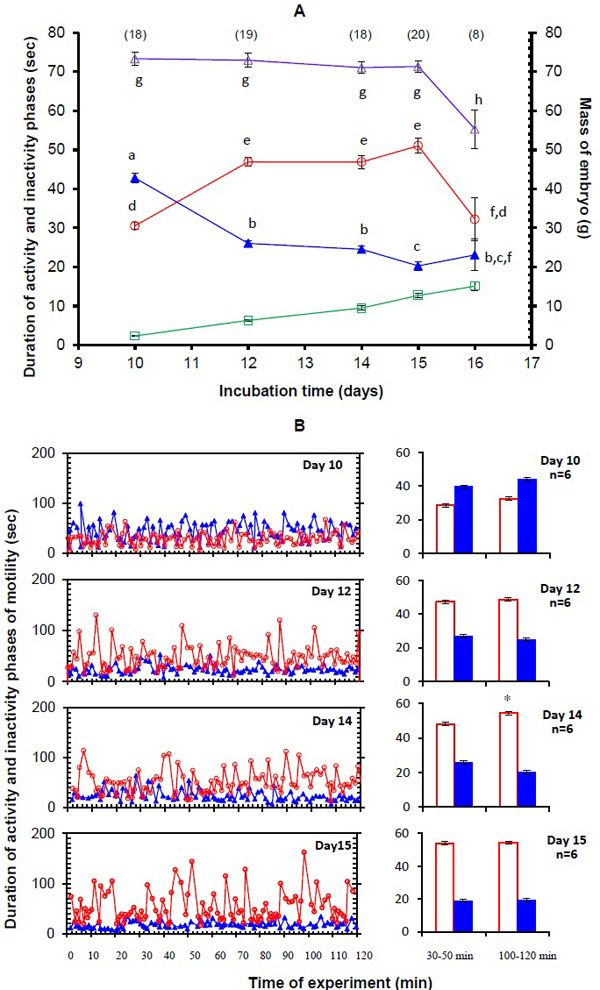
Fig. (2)
Age-related changes of the average duration of activity phase (open circles) and inactivity phase (closed triangles) of chick periodic motility, the average length of the activity - inactivity cycle (open triangles) and embryonic mass (open squares) at different days of incubation (A). Symbols are group averages; bars are 1 SEM. For each parameter, different lowercase letters indicate statistically significant differences among ages (Mann-Whitney U test, P < 0.05). In brackets, number of embryos studied at each age. (B). Left: the plots indicate the sequence of activity phase (open circles) and inactivity phase (closed triangles) of chick motility during 1 complete experiment lasting 120 min in normoxia on incubation days 10, 12, 14 and 15. Right: The histograms present average motility parameters for 20 min in the beginning (period from 30 to 50 min of exposure) and at the end (period from 100 to 120 min of exposure) of a long (120 min) recording in normoxia on incubation days 10, 12, 14 and 15. Open bars are average activity phase duration for 20 min, and solid bars are average inactivity phases for 20 min. Results are expressed as means ± S.E.M. N is the number of embryos studied at each age. (*) - significant difference between average values for the period of 30-50 min, and for the period of 100-120 min during the long normoxic exposure (P < 0.05; Wilcoxon test).