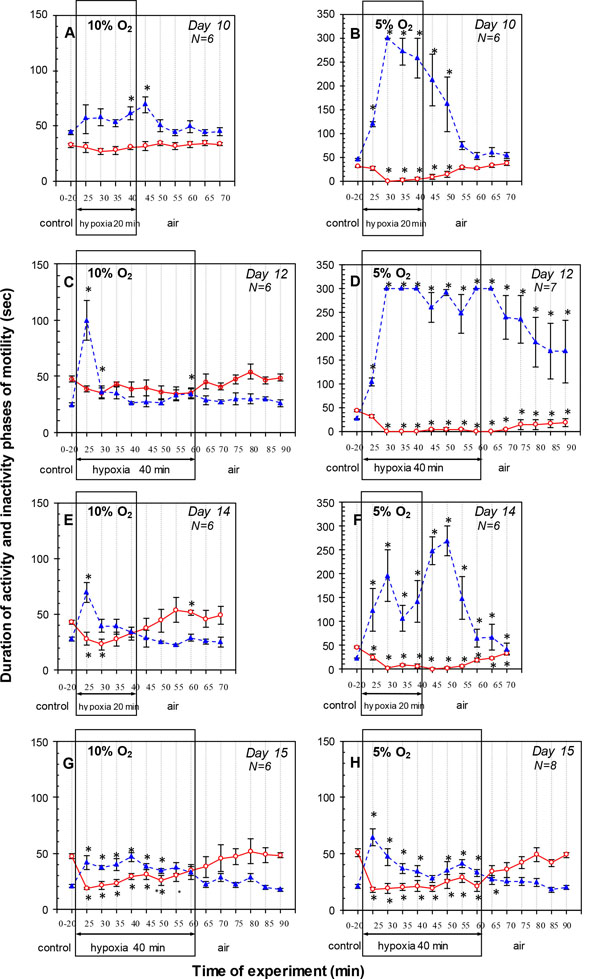
Fig. (4)
The time-course of the activity phase (open circles) and inactive phase (closed triangles) of the chick embryonic motility during acute hypoxia (10% O2 or 5% O2) for 20 min or 40 min and post-hypoxia recovery in air during 30 min on days 10 (A, B), 12 (C, D), 14 (E, F) and 15 (G, H) of incubation. Values are means ± 1 S.E.M. N is the number of embryos studied. The symbol (*) indicates significant differences with the control value (P < 0.05; Wilcoxon test). The control values determined as mean for 20 min prior to hypoxia were plotted at time 0-20. During hypoxia and recovery in air data are presented as averages for every 5 min.