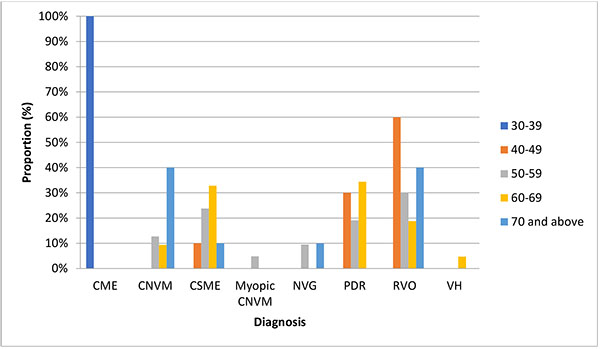
Fig. (2)
A Bar Chart showing the comparison of Diagnosis and the different Age groups.