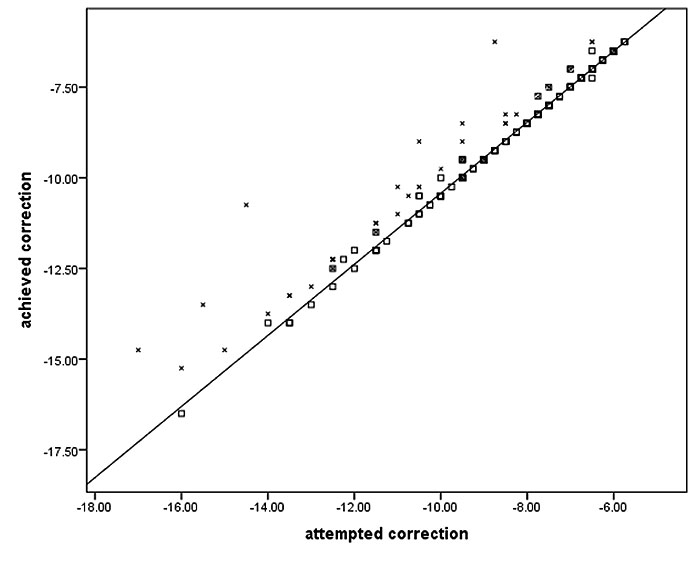
Fig. (1)
Scatter plot diagram of attempted and achieved correction based on sphere. Subjects within target correction are marked box (□), not within target are marked cross (x). Diagonal line indicates perfect match of attempted and achieved correction.