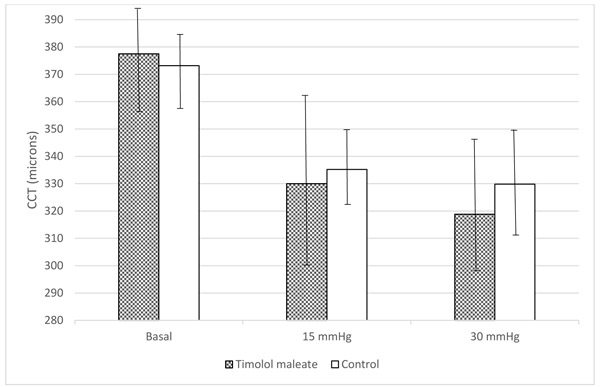
Fig. (2)
The figure shows the differences in the average CCTs at baseline and after increasing the IOP levels to 15 and 30 mmHg between the control and treated groups (p=0.002 basal vs 15 mmHg for both groups, and p= 0.1 for CCT at 15mmHg vs 30 mmHg in the study group and p=0.5 for the same comparison in the control eyes). The error bars represent the standard deviation. The differences between the CCT values between the study and control groups are not statistically significant (p=0.5, p=0.6, and p=0.3 at basal, 15mmHg and 30 mmHg, respectively).