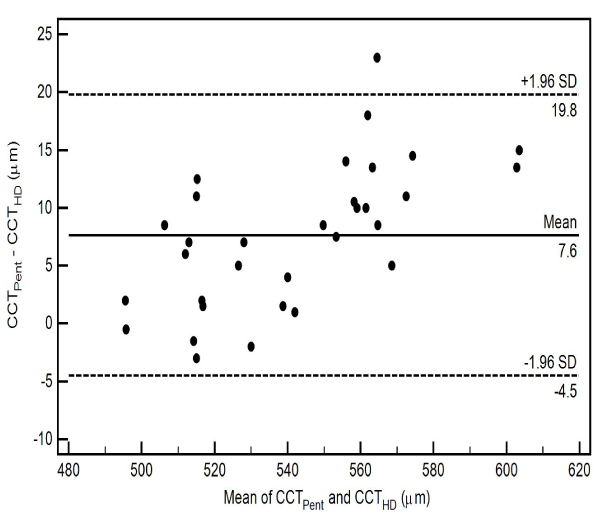
Fig. (5)
Bland-Altman plot comparing CCT
Pent
and CCT
HD
. Mean value, lower and upper limits of agreement are indicated. The mean difference is represented by the solid line and the 95% confidence limits by the dotted lines.