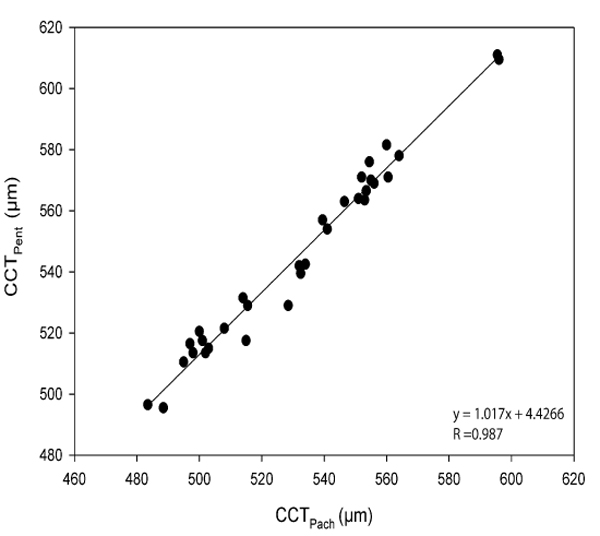
Fig. (6)
Scatter plots between CCT
Pent
and CCT
Pach
measurements (µm) showing a linear regression of
y = 1.017x + 4.42.