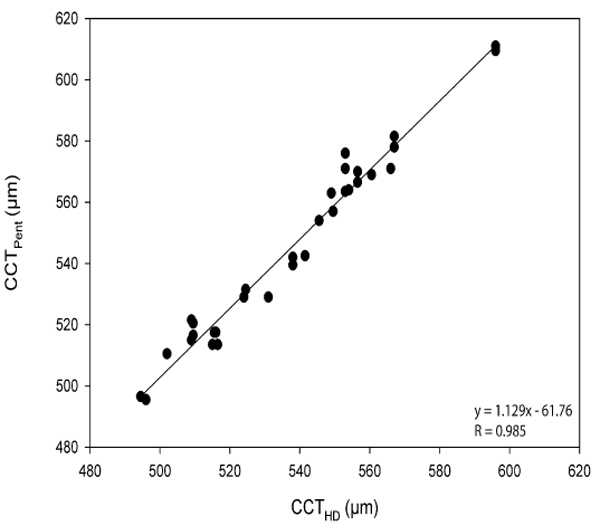
Fig. (8)
Scatter plots between CCT
Pent
and CCT
HD
measurements (µm) showing a linear regression of
y = 1.129x – 61.76.