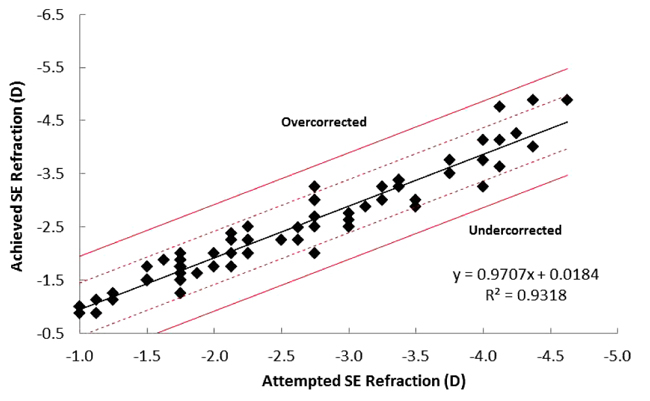
Fig. (1)
Achieved versus attempted SE. The black linear line represents the results of the linear regression analysis. The solid red line indicates error margin of ±1.0 D and dashed red line indicates error margin of ±0.5 D.