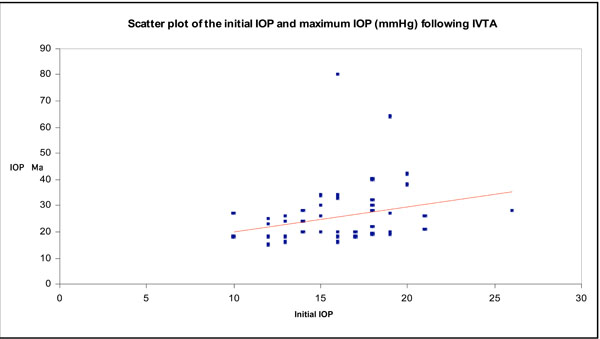
Fig. (1)
Scatter plot of initial IOP versus maximum IOP following IVTA.