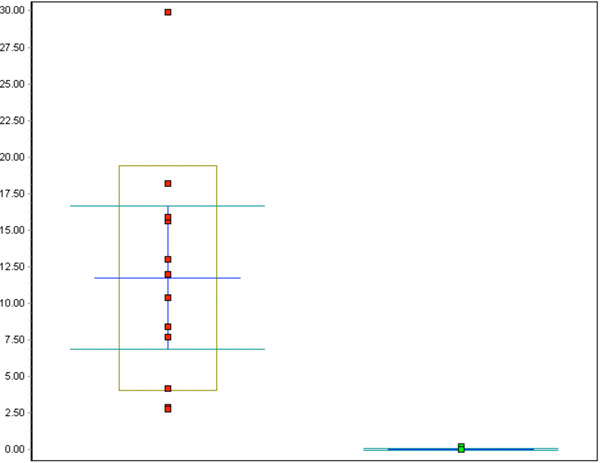
Fig. (6)
Whisker plot of all Ki-67 counts in %: red dots represent the CIN cases, green dots represent the control cases, p<0.001.