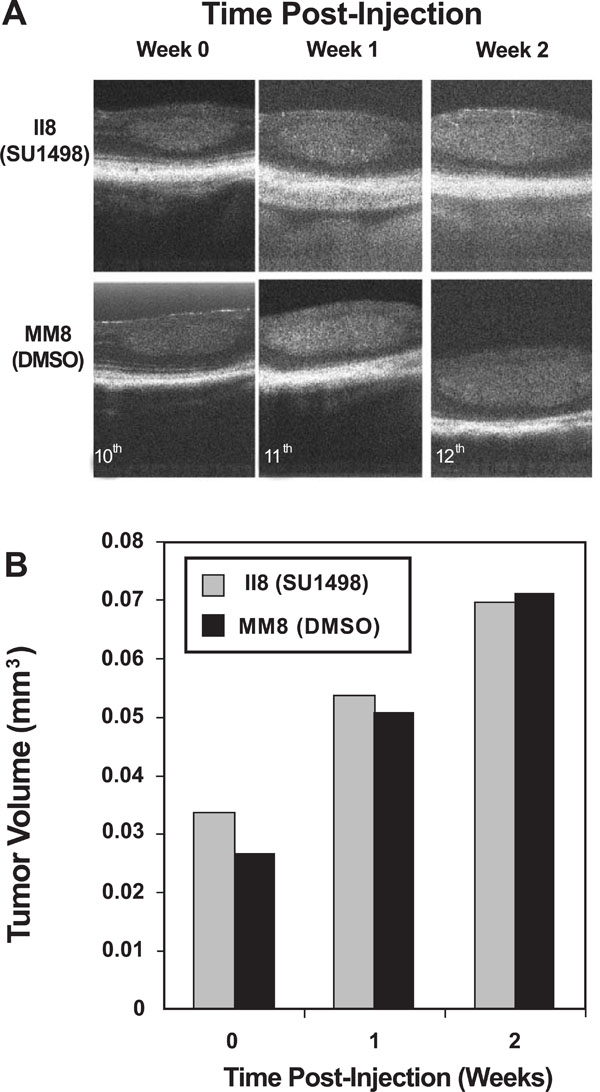
Fig. (4) OCT effectively imaged tumor burden changes in response to SU1498 treatment. In vivo imaging was performed on a registered tumor in one matched pair of LHβTag mice. (A) Pictures of the tumor in cross-section are shown prior to treatment (time 0, age 10 weeks), 1 week post-injection number 1 (11 weeks), and 2 weeks post injection number 1 (12 weeks). (B) Graph of the tumor volume determined by OCT segmentation methods.